

Efficiency Footnotes
Rack Level Footnotes:
Data for the Composite Web Service study in the Efficiency campaign is based on single node performance comparisons measured and published by Ampere Computing. Performance data and the test configurations used to gather the data for each application is published on our web site. In particular, the following table shows the composition of a modeled web service based on best available data to determine scale-out behavior through projections and calculations at both Rack and Data center level. The primary applications used in this analysis are:
1. Rack Level evaluation is based on the total performance required to scale out to 1 Rack of power budget for the Ampere® Altra® Max processors under the weighted load of the stated application composition above. Rack is based on a standard 42U rack with a total power budget of ~14kW including ~10% overhead buffer for networking, mgmt and PDU. Per server power is measured socket level power during fully loaded operation for each architecture, combined with an equivalent system level overhead for motherboard, peripheral and memory power draws. All socket power figures were measured by Ampere during live stress testing and the relative power efficiency ratings can be found at the links provided in the table above.
2. Data Center level analysis is calculated from the rack level analysis and scaled linearly to fit a medium sized data center specification based approximately on publicly available data for the Bluffdale NSA facility in Bluffdale, UT.(1) The data center modeled is 100k ft2, where 65% of the space is reserved for the server room built on an 8 tile pitch. The total power capacity is roughly 66MW based on a PUE assumption of 1.2. More information on data center rack pitch densities can be found through a variety of publicly available analysis(2) Power savings data was calculated using an average cost of power at $0.11/kW Hour(4) and the difference between the best scaled power(Ampere) against the worst power consumption (Intel).
3. Carbon equivalencies were calculated using the EPA equivalency calculator.(3)
(2) https://www.racksolutions.com/news/blog/how-many-servers-does-a-data-center-have/
(3) https://www.epa.gov/energy/greenhouse-gases-equivalencies-calculator-calculations-and-references
(4) https://www.eia.gov/electricity/state/
If an empirical weighting (derived from direct experience in observation of some web work loads that are read heavy) is used, the per formance per rack advantage is greater because of the higher loading of the front- end tiers that utilize NGINX and Redis and which have a greater performance advantage than the backend tiers MySQL and Memcached.
| Web Tier | Application | Perf advantage vs Intel Xeon 8380 | Equal Composition Weighting | Empirical Composition Weighing | Comparative Performance Info Reference |
|---|---|---|---|---|---|
| Front End | NGINX | 3.54 | 25% | 39% | For Altra Max M128-26 |
| Caching Tier | Memcached | 2.11 | 25% | 8% | For Altra Max M128-26 |
| Key Value Store | Redis | 2.62 | 25% | 39% | For Altra Max M128-30 |
| Back End | MYSQL | 1.64 | 25% | 14% | For Altra Max M128-30 |
| Performance per Rack Weighted Advantage | 2.48 | 2.80 |
Device Level Footnotes:
Cost-effectiveness advantage of up to 5.4x based on Table 1.
Up to 3x more embedded compute
As shown in Table 1 [Xeon D compared to M96-28 and M128-26]
75% CPU energy reduction
As shown in Table 1 [Xeon D compared to Q32-17—with the same level of compute]
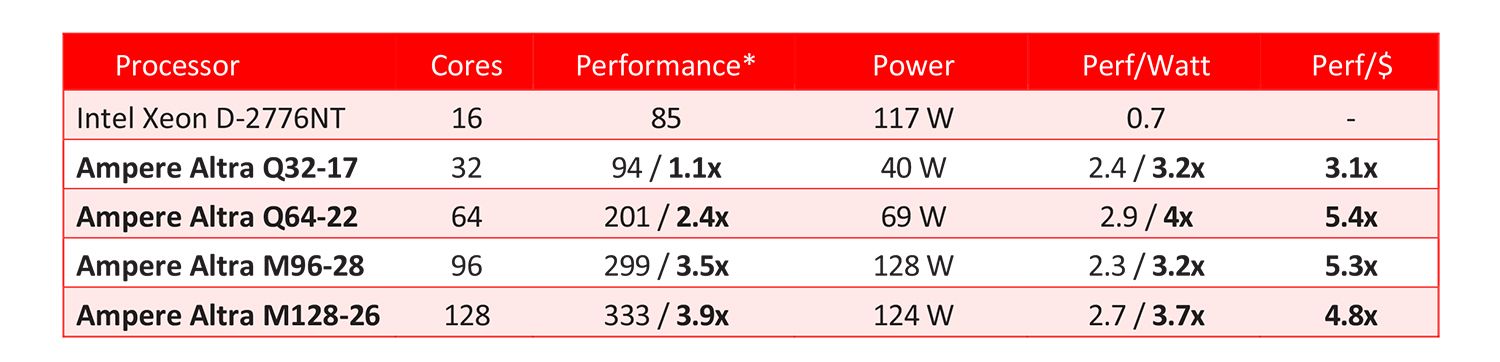 Table 1
In Table 1: Performance and usage power data are based on estimated SPECrate®2017_int_base (GCC10) with a scaling factor of 1.26 between GCC10 and OneAPI compiler as observed on Xeon 8380 and is subject to change based on system configuration and other factors. Usage Power is defined as average power consumed over time by a given workload. Ampere Altra as compared to Xeon D per
https://www.intel.com/content/www/us/en/products/overview.html
https://www.spec.org/cpu2017/results/res2022q4/cpu2017-20221010-32556.html
Up to 3x faster computer vision inference
In Computer Vision using SSD ResNet-50-v1 for a typical Object Detection application Ampere Altra outperforms in latency, Intel Xeon 8375C by up to 4x. See Table 2.
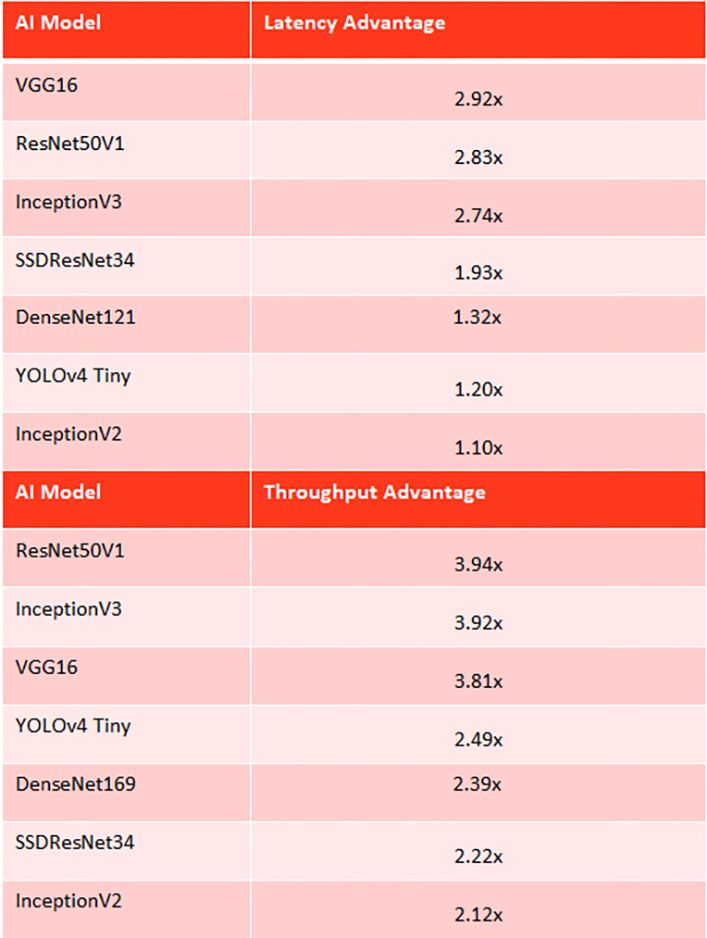
Table 2
Benchmarks were performed with Ampere’s internal testing software based on Ampere Model Library. This software is written entirely in Python and is in-line with MLCommons Inference (a.k.a. MLPerf) methodology of calculating latency and throughput. It utilizes API of frameworks in standard and common ways while replicating usage in real-life applications.
In case of latency benchmarks for each configuration listed below a single system process has been executed at once. Each process, following a warm-up run, has run workloads of batch size equal to 1 in loop for a minimum of 60 seconds. A final latency value has then been calculated on the basis of collected net inference time of each pass through the network.
Intel Xeon 8375C “Ice Lake” - number of threads: 1, 4, 16, 32, 64, 80
Ampere Altra Max M128-30 – number of threads: 1, 4, 16, 32, 64, 128
When it comes to the multi-process throughput benchmarks a search-space of different batch sizes and number of threads per process has been covered. Final throughput values have been estimated based on average (50th percentile) latencies observed during a 60 second multi process runs. All systems were benchmarked running workloads of following batch sizes per each of n parallel processes: [1, 4, 16, 32, 64, 128, 256]. Number of threads per process to number of processes in total was respectively:
Intel Xeon 8375C “Ice Lake” - 1x80, 2x40, 4x20, 16x5, 32x2, 64x1, 80x1
Ampere Altra Max M128-30 – number of threads: 1x128, 2x64, 4x32, 16x8, 32x4, 64x2, 128x1
Benchmarks of all platforms were run with the use of the same scripting, same datasets, same representation of models. All platforms ran the same workloads, applying identical pre- and post- processing and making uniform inference calls. In the case of fp16 Altra data, values were obtained with the use of same scripting, while AI model representations differed from their fp32 counterparts only in the precision of weights – model quantization process involved only casting to a lower float precision.
Across all systems that were put to the test, TensorFlow library was used in its best-known variant available for a given platform:
Intel CPUs – intel-optimized-tensorflow:2.12.0-pip-base and intel-optimized-pytorch:1.12.100-pip
Ampere Altra Max – amperecomputingai/tensorflow:1.6.0 (tf 2.11) amperecomputingai/pytorch:1.6.0 (pytorch 2.0.0)
All benchmarks were run with Python 3.8 in Linux-based environments of the following flavors:
Intel Xeon 8380 “Ice Lake” - Ubuntu 20.04, kernel: 5.11
AMD Epyc 7763 “Milan” - Cent OS 8, kernel: 4.18.0-305.3.1.el8.x86_64
Ampere Altra Max M128-30 – Fedora 35, kernel: 5.16.9-200.THP_NO_FIE.fc35.aarch64
Ampere AI: GPU Free Leadership Inference Performance
-
Ampere benchmarking performed with Ampere-optimized PyTorch 2.0.0 + fp16.
-
Intel Ice Lake 8380 benchmarking performed with Intel-optimized PyTorch 2.0.0 + fp32, part of Intel AI Kit. Intel Sapphire Rapids 8481c benchmarking performed with Intel-optimized PyTorch 2.0.0 + bf16 [amx], part of Intel AI Kit.
-
AMD Milan 7763 benchmarking performed with PyPI’s PyTorch 2.0.1 + fp32. AMD Genoa 9654 benchmarked performed with PyPI’s PyTorch 2.0.1 + bf16 [avx512]
-
Nvidia benchmarking performed with latest Nvidia PyTorch Docker Image. Nvidia provides model conversion tool called TensorRT which increase inference throughput. However, not all models can be converted. Ampere has results of selected models upon request.
-
Pricing is based on published Internet prices, Intel SPR 8481c was not available, Intel SPR 8480+ list price was used.
-
Power for server rack calculations based on standard 12.5kw rack. Power for calculating # of rack systems is CPU+GPU (if equipped) + 242W (M128 & Milan), + 274W Genoa (extra memory channels), + 257W Ice Lake (w/ PCH), +253W SPR (w/ PCH)
-
All perf/watt are based on published TDP values for CPU & GPU only, except M128-30 which is based on actual usage power of 178W. Although actual usage power exceeded TDP at times on x86 CPUs, power used for the purposes of calculating efficiency was capped at TDP.
-
T4 system details: VM at GCP, CPU:Intel(R) Xeon(R) CPU @ 2.00GHz, 16c/32t, GPU: Nvidia T4, 15360MiB, driver: 535.54.03. Memory:7x 16GiB DIMMs + 1x 8GiB DIMM, memory gen and speed hidden by KVM, Linux kernel:5.10.0-23-cloud-amd64
-
A10 system details: BM at OCI, CPU: Intel(R) Xeon(R) Platinum 8358 CPU @ 2.60GHz, 2P, 32c/64t each, GPU:4x NVidia A10 (just one used for benchmarking), 23028MiB, driver: 530.30.02, Memory:16x 64GiB DIMMs, DDR4 3200 MHz, Linux kernel: 5.15.0-1030-oracle
-
Ampere M128-30/M128-26 system details: BM at RTP lab, CPU:Neoverse-N1, 2P, 128c/128t each @ 3GHz, Memory:16x 64GiB DIMMs, DDR4 3200 MHz, Linux kernel: 6.3.13-200.fc38.aarch64
-
Intel SPR 8481c system details: VM at GCP, c3 high-mem shape, CPU:Intel(R) Xeon(R) Platinum 8481C CPU @ 2.70GHz, 44c/88t, Memory:44x 16GiB DIMMs, memory gen and speed hidden by KVM, Linux kernel: 6.1.0-10-cloud-amd64
-
Intel IL 8380 system details: System: BM at RTP lab, CPU: Intel(R) Xeon(R) Platinum 8380 CPU @ 2.30GHz, Memory: 16x 64GiB DIMMs, DDR4 3200 MHz, Linux kernel:6.2.9-300.fc38.x86_64
-
AMD Genoa 9654 system details: BM at RTP lab, CPU:AMD EPYC 9654 96-Core Processor, Memory: 24x 64GiB DIMMs, DDR5 4800 MHz, Linux kernel: 6.2.9-300.fc38.x86_64
-
AMD Milan 7763 system details: BM at RTP lab, CPU: AMD EPYC 7763 64-Core Processor, Memory: 16x 64GiB DIMMs, DDR4 3200 MHz, Linux kernel: 6.2.9-300.fc38.x86_64
-
OCI A1 details: VM at OCI, CPU:Ampere Altra Q80-30, Memory:512GiB, Linux kernel: 5.15.0-1039-oracle, oCPUs– 80, Instance Price: $1.56/hr, PyTorch-AIO r1.7.0 (PyTorch 2.0.0)
-
AWS G5.16xlarge details: VM at AWS, CPU:AMD Milan 7R32 32c/64t, GPU:NVidia A10G 23028MiB, driver: 535.98, Memory:256GiB, Linux kernel: 5.19.0-1025-aws, Instance Price, On-demand, Oregon, $4.10/hr
-
AWS G4DN.16xlarge details: VM at AWS, CPU: Intel Cascade Lake 8259CL 32c/64t, GPU: NVidia Tesla T4 15360MiB, driver: 535.98, Memory: 256GiB, Linux kernel: 5.19.0-1025-aws, instance Price: On-demand, Oregon,$4.35/hr
-
AWS M6i.16xlarge details: VM at AWS, CPU: Intel Ice Lake 8375C 32c/64t, Memory:256GiB, Linux kernel: 5.19.0-1025-aws, Instance Price: On-demand, Northen California, $3.58/hr, oneDNN PyTorch (from PyPI) (PyTorch 2.0.1)
-
AWS M6a.24xlarge details: VM at AWS, CPU: AMD Milan 7R13 48c/96t, Memory: 384GiB, Linux kernel: 5.19.0-1025-aws, Instance Price: On-demand, Northen California, $4.84/hr, oneDNN PyTorch (from PyPI) (PyTorch 2.0.1)
-
AWS M6g.16xlarge details: VM at AWS, CPU: Neoverse-N1 64c (Graviton 2), Memory: 256 GiB, Linux kernel: 5.19.0-1025-aws, Instance Price: On-demand, Northen California, $2.87/hr, armpl Torch (from PyPI) (PyTorch2.0.1)
-
AWS M7g.16xlarge details: VM at AWS, CPU: Neoverse-V1 64c (Graviton 3), Memory: 256GiB, Linux kernel: 5.19.0-1025-aws. Instance Price: On-demand, Oregon, $2.62/hr, armpl PyTorch (from PyPI) (PyTorch 2.0.1)
-
In all benchmarks, the best possible combination of the batch size and the number of processes was selected for the given platform.
Disclaimer:
All data and information contained in or disclosed by this document are for informational purposes only and are subject to change. Your results may differ. This document is not to be used, copied, or reproduced in its entirety, or presented to others without the express written permission of Ampere®.
This document may contain technical inaccuracies, omissions and typographical errors, and Ampere Computing LLC, and its affiliates (“Ampere”), is under no obligation to update or otherwise correct this information. Ampere makes no representations or warranties of any kind, including express or implied guarantees of noninfringement, merchantability or fitness for a particular purpose, regarding the information contained in this document and assumes no liability of any kind. Ampere® is not responsible for any errors or omissions in this information or for the results obtained from the use of this information. All information in this presentation is provided “as is”, with no guarantee of completeness, accuracy, or timeliness.
This document is not an offer or a binding commitment by Ampere®. Use of the products and services contemplated herein requires the subsequent negotiation and execution of a definitive agreement or is subject to Ampere’s Terms and Conditions for the Sale of Goods.
The technical data contained herein may be subject to U.S. and international export, re-export, or transfer laws, including “deemed export” laws. Use of these materials contrary to U.S. and international law is strictly prohibited.
© 2023 Ampere® Computing LLC. All rights reserved. Ampere®, Ampere® Computing, Altra® and the Ampere® logo are all trademarks of Ampere® Computing LLC or its affiliates. Other product names used in this publication are for identification purposes only and may be trademarks of their respective companies.
Ampere Computing LLC
4655 Great America Parkway Suite 601
Santa Clara, CA 95054


