
Introducing the Ampere System Profiler

Know What Your System Is Up To
When optimizing software on modern server processors, knowing “something is slow” is only half the battle. The real win comes from knowing where to look—and doing it quickly, repeatedly, and with enough system context to make the results actionable and meaningful.
At Ampere®, we built the APEX framework (Adaptive Profiling and Examination) to bring structure to performance root-cause analysis and throughput optimization. The central idea is that effective optimization is an ordered workflow: measure the right layer, interpret with the right context, and only then drill deeper. We highlighted the framework in our Ampere Performance Toolkit Blog .
The Ampere System Profiler (ASP) sits at the center of this process. It helps you understand system-stack behavior first, before you spend time tuning the application or microarchitecture.
Why Do We Need the Ampere System Profiler?
Today’s performance issues often come from places that aren’t visible when you only look at high-level application signals. As code and systems have evolved, high-level tuning can miss low-level microarchitecture (uarch) realities and in modern compute stacks, that’s where many inefficiencies hide.
The result is a frustrating loop: symptoms appear (latency, throughput, tail behavior), but the root cause is obscured by interactions across layers.
Many existing utilities and performance workflows are heavy-handed and effectively “one size fits all.”
They don’t impose a structured workflow that tells you:
- What to measure,
- When to measure it,
- Most importantly, how to connect ambiguous symptoms to actionable system causes.
This is exactly why teams often spend time collecting irrelevant or misleading data instead of building system-level evidence.
On real deployments, performance symptoms often emerge from interactions across multiple layers, such as:
- System behavior driven by power, frequency, and thermal constraints
- CPU scheduling behavior and CPU topology effects
- Disk and network saturation
- Kernel-level overheads (interrupt handling, context switching, network stacks)
- NUMA placement and memory traffic patterns
The ASP is designed to expose these interactions while the workload is running. It helps convert ambiguous symptoms (e.g. latency is worse, throughput dropped) into system-level evidence that explains why the workload behaved that way.
How to Apply the Apex Framework
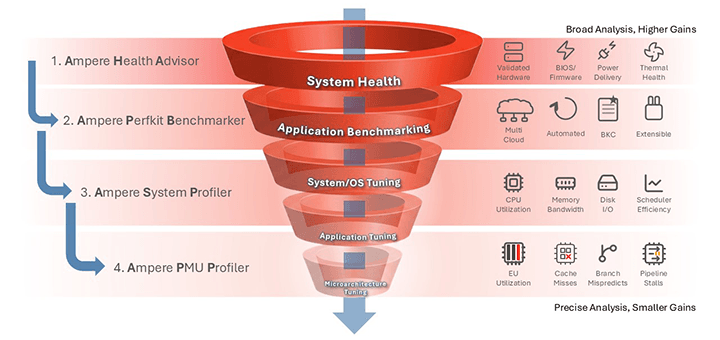
A useful mental model for APEX is moving from broad visibility to targeted investigation:
1. Assess platform health
2. Establish baseline application performance
3. Use the ASP to identify system-level bottlenecks during the workload
4. If needed, move deeper into application tuning
5. Proceed to microarchitecture tuning, if necessary
The Ampere System Profiler helps you answer the why behind the symptoms at the system level, bridging platform behavior with application outcomes.
Together, they reduce guesswork and shorten the debugging timeline.
What is the Ampere System Profiler?
The Ampere System Profiler is a system-aware profiling tool that delivers actionable system-level insight. It is built to answer questions such as:
Which subsystems contribute most to time spent?
- Is the workload CPU-bound, memory-bound, or I/O-bound?
- How do scheduling behavior and CPU topology impact throughput and latency?
- Do two runs that look similar at the application level hide meaningful system-level differences?
- Are platform-level effects such as power, frequency, or thermal behavior shaping results?
In short, the ASP helps you connect application symptoms to system causes using evidence collected during the sample window.
What the ASP Collects (System Level)
The ASP runs multiple Linux collectors concurrently while your workload executes. The intent is to capture a coherent view of system behavior across subsystems during the same time window. Collectors include:
- CPU utilization and split between user vs. system time
- NUMA statistics to understand memory behavior by node
- Socket/power behavior (where supported) to observe platform power and performance state dynamics
- Network utilization to detect saturation, bursts, and imbalance
- Disk I/O to detect throughput and stall patterns
- Perf-based hotspot functions to identify where CPU cycles are being spent (including user and kernel paths)
The ASP generates readable HTML reports for rapid triage and stores raw data for deeper investigation when the investigation needs to go beyond summary charts.
Typical Use Cases
The ASP accelerates root-cause analysis in scenarios such as:
- Tail latency investigation: determine whether spikes correlate with scheduling, contention, interrupts, or platform state changes
- Capacity planning: verify whether workloads scale with CPU resources or hit memory/I-O constraints
- Regression debugging: compare runs to identify system-level behavioral shifts not visible in application logs
- Performance tuning validation: confirm that a change improved the true underlying bottleneck (not only benchmark harness behavior)
- Environment comparisons: understand why behavior differs across nodes, configurations, kernel/runtime settings, or deployment topologies
When Should You Use the Ampere System Profiler?
Consider using the ASP when:
- You have performance symptoms but need system-level root-cause evidence
- Performance varies between runs, nodes, or environments
- You need to connect workload behavior to platform behavior (CPU, memory, power, interrupts)
- You are evaluating kernel/runtime changes, container placement strategies, or system configuration changes.
Call to Action
For more detail on the methodology and how to apply it end-to-end, download the ASP Tutorial, run the included guidance.
To learn more about the Ampere System Profiler, check out our videos: Stop the Guesswork: Identifying Bottlenecks with the Ampere System Profiler and The Ampere System Profiler - Optimize Your Cloud Instance
CONCLUSION
Performance engineering is about understanding system interactions, not just isolated metrics.
The Ampere System Profiler helps you see those interactions clearly bridging the gap between application symptoms and system causes with repeatable system-level evidence.
Related Content
Ampere Computing LLC
4655 Great America Parkway Suite 601
Santa Clara, CA 95054