
Ampere System Profiler: A Guide to System Level Profiling
Ampere System Profiler: A Guide to System Level Profiling
Executive Summary
The Ampere® System Profiler (ASP) is a python command line interface utility that uses a set of Linux profiling tools to gather system-level performance metrics while running applications of interest. The system level collectors run in parallel and provide detailed reporting on network, disk, CPU utilization, and top functions via perf during the sample period. This is helpful to determine system-level bottlenecks.
One of the foundational features of the ASP is its easy-to-read HTML reports that provide a simple view of the collectors’ outputs. Additionally, all the raw data to generate reports are saved in logs should an end user need to explore system profiles in greater detail. Running this tool is simple and provides an easy to run command line with minimal overhead to accurately profile any benchmark. This tool is part of the Ampere Performance Toolkit (APT) and can be used for a performance engineer’s top-down approach to root-causing performance problems.
What is the Ampere System Profiler?
The Ampere System Profiler (ASP) is comprised of multiple collectors which collect:
- numastat
- socket power
- CPU utilization
- network utilization
- perf functions.
They run concurrently in the background while the user collects profiles of applications or benchmarks on Ampere systems. The ASP project can be found on Ampere’s Github page. The core of the ASP’s utility comes from opensource Linux profilers.
Why Do We Need the Ampere System Profiler?
Ampere System Profiler exists as part of the larger Ampere Performance Toolkit and is used as an application or benchmark performance analysis tool, and is particularly useful in identifying system level bottlenecks to help identify sources of performance issues. It can be used to help understand:
- What system resources are undersaturated or are experiencing bottlenecks
- OS-level metrics like IRQ affinity and context switch rate
- The amount of user and kernel time being spent on the CPU
- Application-level functions that consume CPU cycles during the sample period
When Do We Use the Ampere System Profiler?
Understanding the APEX framework
Performance tuning is a process of systematic investigation, moving from a broad, system-wide view down to the specific interactions between code and hardware.
The Adaptive Profiling and Execution (APEX) Benchmarking & Optimization Funnel
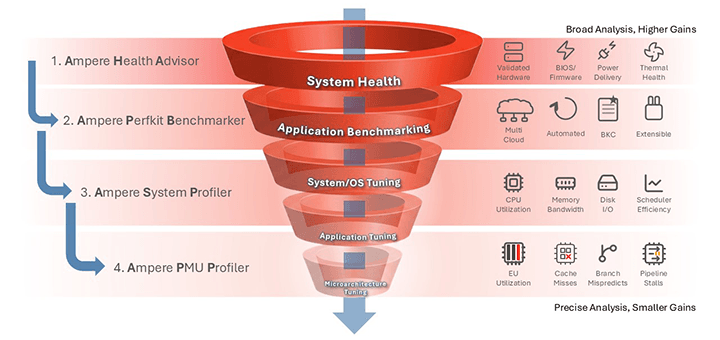
Performance Optimization is as much art as it is science. The APEX framework uses tools and methodologies to add structure and rigor to the process and can bridge the gap between creative intuition and empirical fact.
We propose applying the APEX (Adaptive Profiling and Execution) methodology to enable root cause analysis for solving performance problems. Follow the funnel above from top to bottom to effectively use the procedure.
The methodology recommends starting with assessing platform health as a first step to ensure that platform used for performance analysis is set up well. An unhealthy platform may mislead the performance analysis.
Consider capturing initial performance metrics before tuning any system or application settings. This establishes a clear understanding of the current workload and identifies key scalability knobs. We recommend using Ampere’s PerfKit Benchmarker (APB), which supports many open-source applications, to create a reliable baseline for further analysis and tuning.
Next, is to assess system performance and any hardware or system bottlenecks while the code is – this is where the Ampere System Profiler (ASP) is useful to eliminate any system or resource bottlenecks. The ASP can also be used to right-size the instance shape and ensure that the compute resources are efficiently consumed by the workload.
One method which may be used is to leverage the APB’s automated benchmarking framework to start and stop ASP’s collectors during run phase of a given APB benchmark. This ensures that profile is collected while critical code paths are executed and clear report profile is generated.
Once system and resource bottlenecks are eliminated, if the performance issue persists and points to CPU cycles not being used efficiently, we propose going to the next step in the pyramid and using the Ampere PMU Profiler to root-cause the issue further.
Finally, system benchmarking should be done after all bottlenecks are resolved or analyzed to effectively measure the system’s performance for the workload.
Following this systematic APEX methodology ensures that we eliminate possible issues as a part of a structured process to efficiently conduct root cause analysis.
System-Level Analysis
Goal: Understand the overall system health and identify the primary resource bottleneck. Is the application limited by CPU, Memory, Disk I/O, or Network?
Key Questions:
- Is the overall CPU utilization high?
- Is it predominantly user time or system time (application or kernel)?
- Is the system swapping or under memory pressure?
- Is the application spending a lot of time waiting for I/O (iowait)?
- Are there system limitations?
- Is the network oversaturated?
- Is the CPU load evenly distributed?
- Are the top functions mostly spent in kernel?
Common Tools:
- sar
- mpstat
- numastat
- iostat
- sensors
- perf
The Ampere System Profiler utilizes all these collectors within a single command line interface.
Example usage and Output:
“asp -n 20 -i 2 -N eboot0 –F 99 –o example”
Let’s break down this command; “asp” is the cli utility for invoking the tool. Passing “–n” is the number of samples a user wants to collect, and “-I" is the frequency in seconds to collect each sample. This is required to capture a network interface “-N”, which is capitalized, and tells the network profiler which interface to profile. Finally, “-F” indicates the frequency rate in Hz to collect its profile. The perf frequency rate will have a significant impact on the file size, and a lower rate reduces the overall file size which is useful for longer running profiles. The user can then pass “-o” to designate where they want data outputted.
The above command collects:
- 20 samples
- Sets interval of 2 seconds
- Runs for a total of (samples x interval) - 40 seconds
- Collects network information (-N) on NiC labeled eboot0
- Uses perf record collection frequency of 99 Hz as the default sampling rate
- Writes logs to an output directory titled “example”
Metrics reported by the Ampere-System-Profiler:
| Metric Name | Description |
|---|---|
| CPU Utilization | Percentage of CPU Utilization over Time. Includes percent of system time and percent of user time (application) |
| Average Per Core Utilization | Average User/System time per core during sample period |
| CPU Frequency | Average per core frequency during sample period |
| Socket Power | Shows CPU Socket Power over Time for CPU+IO |
| Numastat | Shows per node memory statistics |
| Disk I/O | Outputs Disk Bandwidth over time during sample period |
| Network I/O | Shows network bandwidth during sample period |
| Perf Top Functions | Shows top perf record functions as percentage of cycles during sample period. Includes application code and kernel code |
Case Study: Redis Performance Regression
Problem statement: A 55% performance regression was observed when running Redis in a virtual machine (VM). The ASP was used to help identify and mitigate two separate issues.
First, the CPU profile indicated a large proportion of %soft IRQs being handled due to network saturation generated by the memtier traffic generation utility. Unbound IRQs accounted for up to 80% core utilization for %soft IRQs compared to 45% on a competitive platform.
This finding led the team to choose tcp_stream as a simple reproducer to simulate the behavior running Redis over the network to try and investigate issue further. Pinning the IRQs to core 1 enabled team to isolate perf report generated by the ASP to compare hot functions running during benchmark with simple reproducer. The results concluded that a large proportion of the system time is being spent copying data from kernel space to user space during critical period of benchmark. This enabled the team to develop mitigations for reducing CPU time spent for this hot function.
The second finding occurred running tcp_stream in lab environment where performance did not align with what was observed, and performance observed in cloud environment was not reproducible on bare metal instances. However, a new problem was uncovered. After some configuration alignment, a system profile was performed again showing an additional hot function where the host instance spends a significant time in spin locks. This provided clues to collect lock stat reports showing much higher wait times with the malformed NIC coalescing settings. This resulted in code fixes being made to kernel code and up-streamed to larger open-source communities.
Example Report – Redis Network Bottleneck and High System Time
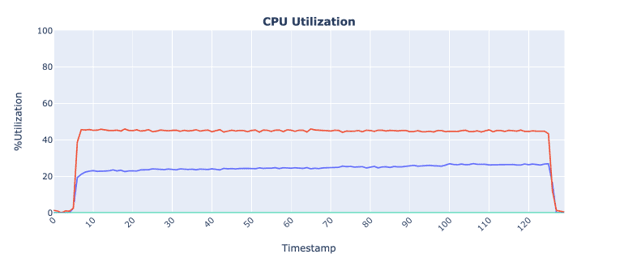
Fig 1: CPU Utilization Over Time
The red line on the time series on the left indicates that a majority of CPU utilization is occurring because of high system time. A healthy application will spend majority of time in user space where CPU time is doing majority of work in application code. This high amount of system time indicates that a lot of CPU time is spent outside of critical path code. Notice as well that the green line, which indicates %IOWait, is nearly 0% indicating little to no IO operations.
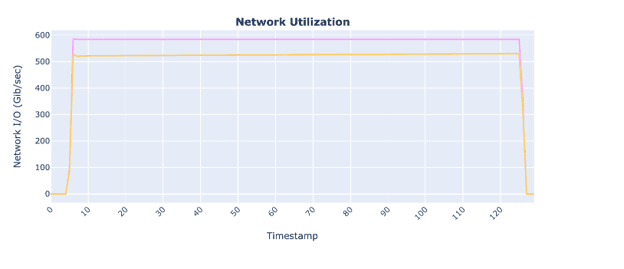 Fig 2: Network Utilization over Time
The generated Network Utilization chart shows that on this system NIC is fully saturated and cannot handle any more network bandwidth being sent by the memtier load generator.
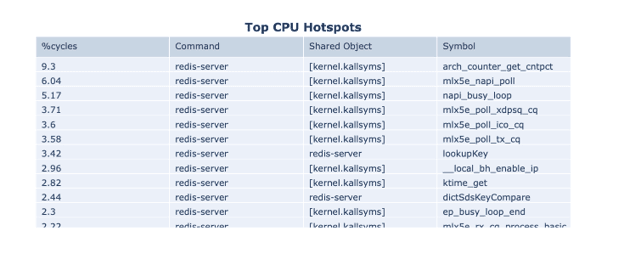
Fig 3: Top CPU Hotspots During Sample Period
The perf report that generates the Top CPU Hotspots output shows that the redis-server is spending majority of cycles servicing network related to mlx5e functions to processing incoming networking packets in kernel space.
Conclusion
The Ampere System Profiler (ASP) provides an efficient, system-level view of performance bottlenecks while an application or benchmark runs. By collecting CPU (user vs kernel), NUMA, disk and network utilization, socket power, and perf-based hotspot functions in parallel, ASP helps performance engineers quickly determine whether a workload is constrained by system resources or by inefficient CPU cycles in specific call paths. Following the APEX methodology, ASP is used first to eliminate platform and resource bottlenecks; if the issue persists, you can then proceed to deeper CPU root-cause analysis with PMU-based profiling and targeted instrumentation. The resulting HTML reports and raw logs enable both fast triage and deeper investigation when needed.
We invite you to download and try the Ampere Performance Toolkit from the Ampere Performance Toolkit Repository. To learn more about our developer efforts and find best practices, visit Ampere’s Developer Center and join the conversation in the Ampere Developer Community.
Related Content
Ampere Computing LLC
4655 Great America Parkway Suite 601
Santa Clara, CA 95054