
Ampere® PMU Profiler: A Guide to Microarchitectural Performance Analysis
Ampere® PMU Profiler: A Guide to Microarchitectural Performance Analysis
Executive Summary
The Ampere® PMU Profiler is a python-tool designed to give developers and performance engineers deep insight into the microarchitectural behavior of applications running on Ampere CPUs. While standard profilers identify where time is spent (e.g., in which function), the Ampere PMU Profiler explains why that time is being spent by measuring low-level hardware events.
This capability is crucial for unlocking the full performance potential of Ampere CPUs. By understanding CPU-level bottlenecks such as inefficient instruction fetching, data cache misses, or branch mispredictions engineers can make targeted code optimizations that are impossible to identify with application-level tools alone. This document outlines a top-down performance analysis methodology, positioning the Ampere PMU Profiler as the microarchitecture-focused stage of that workflow, and provides a practical guide for its use. After broad system triage, APP explains whether a workload is frontend bound, backend bound, memory limited, or coherence limited, and that guidance can then be paired with hotspot tools for function and loop-level attribution. Adopting this tool will lead to more efficient software, better resource utilization, and a stronger competitive advantage for workloads running on Ampere processors.
What is the Ampere PMU Profiler?
The Ampere PMU Profiler is a Linux-based python utility that provides a user-friendly interface to the Performance Monitoring Unit (PMU) on Ampere CPUs (e.g., Ampere® Altra®, AmpereOne®)
- What is a PMU? A PMU is a specialized hardware component within a CPU. It contains a set of counters that can be programmed to count specific hardware events. These events represent the fundamental operations and potential inefficiencies of the CPU core, such as:
- Instructions retired
- CPU cycles
- Cache misses (L1, L2, L3)
- Branch mispredictions
- Stalls in the instruction pipeline
The Ampere PMU Profiler leverages the underlying Linux perf subsystem but simplifies the process by providing a curated list of Ampere-specific event names, pre-defined event groups for common analysis scenarios, and a streamlined workflow. This is implemented in python and is open sourced at https://github.com/AmpereComputing/ampere-pmu-profiler
Why is the Ampere PMU Profiler needed?
In a competitive landscape, simply running software is not enough; it must run efficiently. The Ampere PMU Profiler is essential for achieving this goal for several key reasons:
- To Answer "Why" is My Code Slow?
- Application Profilers (gprofng, Valgrind): Tell you which function is slow.
- APP: Tells you why the hardware is executing that function slowly. Is it waiting for memory? Is it fetching instructions inefficiently? This is the missing piece of the puzzle.
- Unlocking the Full Potential of Hardware: Ampere CPUs are designed for high-throughput, cloud-native workloads with a high core count. Generic code may not automatically take full advantage of our specific microarchitectural strengths. The PMU profiler provides the data needed to optimize algorithms and data structures specifically for our hardware.
- Data-Driven Optimization: It moves performance tuning from guesswork ("I think it's a memory issue") to a scientific, data-driven process ("The L2 data cache miss rate is 15%, which is correlated with a pipeline stall of 30%"). This saves engineering time and leads to more effective optimizations.
- Identifying "Invisible" Bottlenecks: Some of the most significant performance issues are not obvious from source code. For example, false sharing in multi-threaded applications, poor instruction cache layout, or DRAM bank conflicts are only visible through hardware performance counters.
- Competitive Benchmarking and Analysis: When analyzing our performance against competitors or evaluating a new software stack, the PMU Profiler allows us to understand performance differences at the most fundamental level.
When Do We Use the Ampere PMU Profiler?
The Ampere PMU Profiler is usually not the very first tool in an investigation, but once the workload is known to be CPU-bound or is showing an unexplained regression or scaling issue, it can be brought in early. In practice it complements hotspot tools rather than sitting strictly before or after them. It should be used:
- During CPU-bound triage or after hotspots are identified: Use APP to get a workload-wide microarchitectural view (frontend vs. backend, memory vs. core, coherence vs. capacity), then pair it with perf record, perf report, or flame graphs when you need function- or loop-level attribution.
- When performance scaling is sub-linear: When adding more threads or cores doesn't result in the expected performance improvement.
- To investigate performance regressions: When a code change results in a slowdown that isn't easily explained by the code logic itself.
- For final-stage performance tuning: To squeeze the last 10-20% of performance out of a critical application by fine-tuning its interaction with the hardware.
- To evaluate compiler effectiveness: To check if compiler optimizations (like vectorization or loop unrolling) are having the desired effect on the hardware.
Example usage and Output
app -n 120 -c 1,2 -i 1 --tda -o <my_folder> -j "taskset -c 1,2
the above example command collects
- PMU profiling samples for 120s
- With a sampling interval of 1s
- Collects profiles for cores 1 and 2
- TopDown metrics and render a TDA sunburst chart
- PMU profiles while running the workload affinitized to cores 1 and 2.
Metrics reported by APP:
| Metric Name | Description |
|---|---|
| IPC | Instructions retired per CPU cycle (user + kernel unless separated). |
| IPC_kernel | Instructions retired per CPU cycle while executing in kernel/EL1. |
| cpu_freq | Average core frequency during the measurement interval (typically in GHz or MHz). |
| #Cycle_Accounting Metrics | |
| frontend_bound | Fraction of cycles where retirement is limited by the front-end (fetch/branch prediction/decode/ICache/ITLB/queueing). |
| backend_bound | Fraction of cycles where retirement is limited by the back-end (execution resources, cache/memory latency/bandwidth, ROB/LSQ pressure). |
| #Branch_Effectiveness Metrics | |
| branch_mispredict% | Percent of retired branch instructions that were mispredicted (causing pipeline recovery/flush). |
| branch_mpki | Branch mispredictions per 1,000 instructions retired. |
| #DTLB_Effectiveness Metrics | |
| dtlb_mpki | Data TLB misses per 1,000 instructions retired (that require translation refill/walk beyond L1 DTLB). |
| dtlb_walk% | Percent of DTLB misses that trigger a page-table walk (vs. being satisfied by a next-level TLB). |
| l1d_tlb_miss% | L1 DTLB miss rate (L1 DTLB misses divided by DTLB accesses). |
| l1d_tlb_mpki | L1 DTLB misses per 1,000 instructions retired. |
| l2_tlb_miss% | L2/second-level DTLB miss rate (misses divided by L2 TLB accesses). |
| l2_tlb_mpki | L2/second-level DTLB misses per 1,000 instructions retired (typically correlates with page walks). |
| #ITLB_Effectiveness Metrics | |
| itlb_mpki | Instruction TLB misses per 1,000 instructions retired. |
| itlb_walk% | Percent of ITLB misses that trigger a page-table walk (vs. hit in a next-level TLB). |
| l1i_tlb_miss% | L1 ITLB miss rate (misses divided by ITLB accesses). |
| l1i_tlb_mpki | L1 ITLB misses per 1,000 instructions retired. |
| #L1_Cache_Effectiveness Metrics | |
| l1i_mpki | L1 instruction cache misses per 1,000 instructions retired. |
| l1d_mpki | L1 data cache misses per 1,000 instructions retired. |
| l1i_miss% | L1 instruction cache miss rate (misses / accesses). |
| l1d_miss% | L1 data cache miss rate (misses / accesses). |
| #L2_Cache_Effectiveness Metrics | |
| l2_mpki | L2 cache misses per 1,000 instructions retired (typically demand misses; exact scope depends on event mapping). |
| l2_miss% | L2 cache miss rate (misses / L2 accesses). |
| l2d_inv_pki | L2 data cache invalidations per 1,000 instructions (coherency-driven invalidations affecting this core/cluster). |
| l2_snoops_pki | L2 snoop transactions per 1,000 instructions (coherency probes observed/handled). |
| l2d_inv_per_snoop | Average invalidations generated per snoop (invalidation intensity per probe). |
| #Operation_Mix Metrics | |
| branch_percentage | Percent of retired instructions that are branch instructions. |
| crypto_percentage | Percent of retired instructions that are crypto/CRC/hash-class instructions (Arm crypto extensions). |
| integer_dp_percentage | Percent of retired instructions that are integer data-processing (ALU) operations. |
| load_percentage | Percent of retired instructions that are loads. |
| store_percentage | Percent of retired instructions that are stores. |
| scalar_fp_percentage | Percent of retired instructions that are scalar floating-point operations. |
| simd_percentage | Percent of retired instructions that are SIMD/NEON (vector) operations. |
| #Pipeline_Stall_Frontend | |
| stall_frontend_cache_rate | Fraction of cycles stalled due to instruction-side cache/fetch delivery issues (e.g., I-cache misses/linefill effects). |
| stall_frontend_tlb_rate | Fraction of cycles stalled due to ITLB/translation-related front-end stalls. |
| stall_recovery_rate | Fraction of cycles spent recovering from pipeline flushes (commonly branch mispredict recovery and similar redirects). |
| stall_fronetend_bob_rate | Fraction of cycles stalled because the front-end buffer/queue (often “branch/order buffer” or fetch/decode buffering) is full/blocked, limiting delivery to the back-end. |
| #Pipeline_Stall_Backend | |
| stall_backend_cache_rate | Fraction of cycles stalled due to cache hierarchy latency on the data side (L1D/L2/SLC effects excluding pure DRAM bandwidth). |
| stall_backend_tlb_rate | Fraction of cycles stalled due to DTLB misses/page-walk latency impacting loads/stores. |
| stall_backend_mem_rate | Fraction of cycles stalled due to main-memory/DRAM latency or bandwidth limits (off-chip). |
| stall_backend_core_rate | Fraction of cycles stalled due to core execution limits (e.g., dependency chains, execution-unit throughput). |
| stall_backend_resource_rate | Fraction of cycles stalled due to internal resource pressure (queues, buffers, credits) not attributed to a specific unit. |
| stall_rob_id_rate | Fraction of cycles where progress is limited by reorder buffer / in-flight instruction capacity (ROB full / cannot dispatch/retire). |
| stall_ixu_sched_rate | Fraction of cycles stalled due to integer execution scheduler/issue queue pressure (IXU scheduling bottleneck). |
| stall_fsu_sched_rate | Fraction of cycles stalled due to FP/SIMD execution scheduler/issue queue pressure (FSU scheduling bottleneck). |
| stall_lob_id_rate | Fraction of cycles stalled due to load buffer/queue (load-order/load buffer) being full or blocked. |
| stall_sob_id_rate | Fraction of cycles stalled due to store buffer/queue (store-order/store buffer) being full or blocked. |
| #uncore metrics | |
| slc_miss% | System-level cache (SLC/LLC) miss rate for requests reaching SLC (misses / accesses). |
| mc_retry_rate% | Percent of memory-controller transactions that are retried (e.g., due to contention/queue full/flow-control), indicating fabric/MC pressure |
| Estimated DRAM read bandwidth consumed (GB/s). | |
| memrd_bw_GBps | Estimated DRAM write bandwidth consumed (GB/s). |
| memwr_bw_GBps | |
| CCIX (coherent interconnect) inbound bandwidth to the socket/system (MB/s). | |
| ccix_in_bw_MBps | CCIX outbound bandwidth from the socket/system (MB/s). |
| ccix_out_bw_MBps | CCIX outbound bandwidth from the socket/system (MB/s). |
A Workflow-level Top-Down Methodology
Here, "top-down" refers to the investigation workflow: start with a broad system view, narrow to application level, and then use PMU data to characterize the workload’s behavior on underlying hardware. APP also provides a separate TopDown Accounting (TDA) view, which is a PMU-derived cycle breakdown used only at Level 3 of this workflow. The two terms are related but not interchangeable.
Level 1: System-Level Analysis
- Goal: Understand the overall system health and identify the primary resource bottleneck. Is the application limited by CPU, Memory, Disk I/O, or Network?
- Key Questions:
- Is the overall CPU utilization high?
- Is the system swapping or under memory pressure?
- Is the application spending a lot of time waiting for I/O (iowait)?
- Common Tools: top, htop, vmstat, sar, iostat, netstat and Ampere System Profiler
- Outcome: A high-level characterization of the bottleneck. If the workload is confirmed to be CPU-bound (high user-space CPU utilization), you proceed to the next level.
| Tool | Metric | Indication |
|---|---|---|
| top / htop | %CPU, %MEM | High CPU usage points to a CPU-bound workload. |
| vmstat | si, so | Non-zero values indicate swapping (memory pressure). |
| iostat | %iowait, await | High values indicate a disk I/O bottleneck. |
Level 2: Application-Level Analysis
- Goal: Identify the "hotspots" within the application. Which functions or code paths are consuming the most CPU time?
- Key Questions:
- Where is my application spending time?
- What is the call graph hierarchy leading to these hotspots?
- Common Tools: perf record/perf report, gprof, Valgrind/callgrind.
- Outcome: A list of one or more functions that are the primary targets for optimization. You now know where to look, but not yet why it's slow.
Level 3: Microarchitecture-Level Analysis (APP's Domain)
- Goal: Understand why the identified "hot" functions are slow by analyzing their interaction with the CPU hardware.
- Key Concepts:
- Frontend vs. Backend: The CPU pipeline is broadly split. The Frontend fetches instructions, decodes them, and predicts branches. The Backend executes the instructions (ALU operations, memory access). A stall in one could starve the other.
- Instructions Per Cycle (IPC): A key measure of efficiency. IPC = (Instructions Retired) / (CPU Cycles). An IPC below 1.0 often indicates stalls. A high IPC (e.g., >2.0) indicates high efficiency.
- Memory Hierarchy: Accessing data gets exponentially slower as you move from registers -> L1 cache -> L2 cache -> L3 cache -> DRAM. Cache misses are a primary cause of performance loss.
- The Ampere PMU Profiler's Role: At this level, APP can be used to collect hardware events related to microarchitecture level analysis as described in Figure 1 to understand where stalls might be in your pipeline.
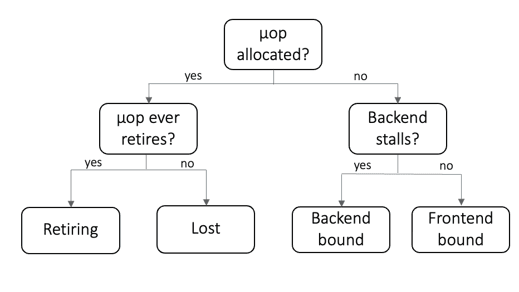 Fig. 1
Analysis Workflow:
- Form a Hypothesis: Use APP's workload-wide signature together with hotspot tools to identify the function or loop you want to explain. APP tells you what kind of bottleneck you have; perf record or flame graphs tell you where it occurs.
- Measure a Baseline with Ampere PMU Profiler: Capture APP data for the baseline workload using fixed input, core affinity, runtime length, and system settings.
- Change One Thing and Re-run: Modify the target loop, data layout, or synchronization pattern and rerun the same workload under identical conditions
- Compare Before vs. After: Use the HTML report and TDA sunburst to verify that the suspected bottleneck moves in the expected direction, for example higher IPC, lower backend-memory stalls, lower cache or TLB MPKI, or fewer coherence events.
- Start with the dominant TDA domain: Identify the largest top-level category first before drilling into subdomains.
- Drill down hierarchically: Follow only the flagged subdomains and ignore low-signal branches until the remaining candidates are specific enough to act on.
- Corroborate with broader APP metrics: Check cache, TLB, memory-bandwidth, coherence, and mesh or uncore metrics under the same test conditions.
- Close the loop with code attribution when needed: If the microarchitectural diagnosis is clear but the exact loop is not, return to perf record, perf report, flame graphs, or source inspection to map the signal back to the precise code change.
Case Studies:
#1: Confirm expected application behavior using TopDown Accounting(TDA) - DGEMM (BLIS)
To illustrate how the Ampere PMU Profiler and TopDown Accounting (TDA) helped identify performance limits in real HPC codes, we profiled DGEMM (double‑precision GEMM) from BLIS, a canonical dense linear algebra kernel. DGEMM is expected to scale with matrix dimension until it becomes limited by core compute throughput and/or microarchitectural resources, rather than by memory bandwidth.
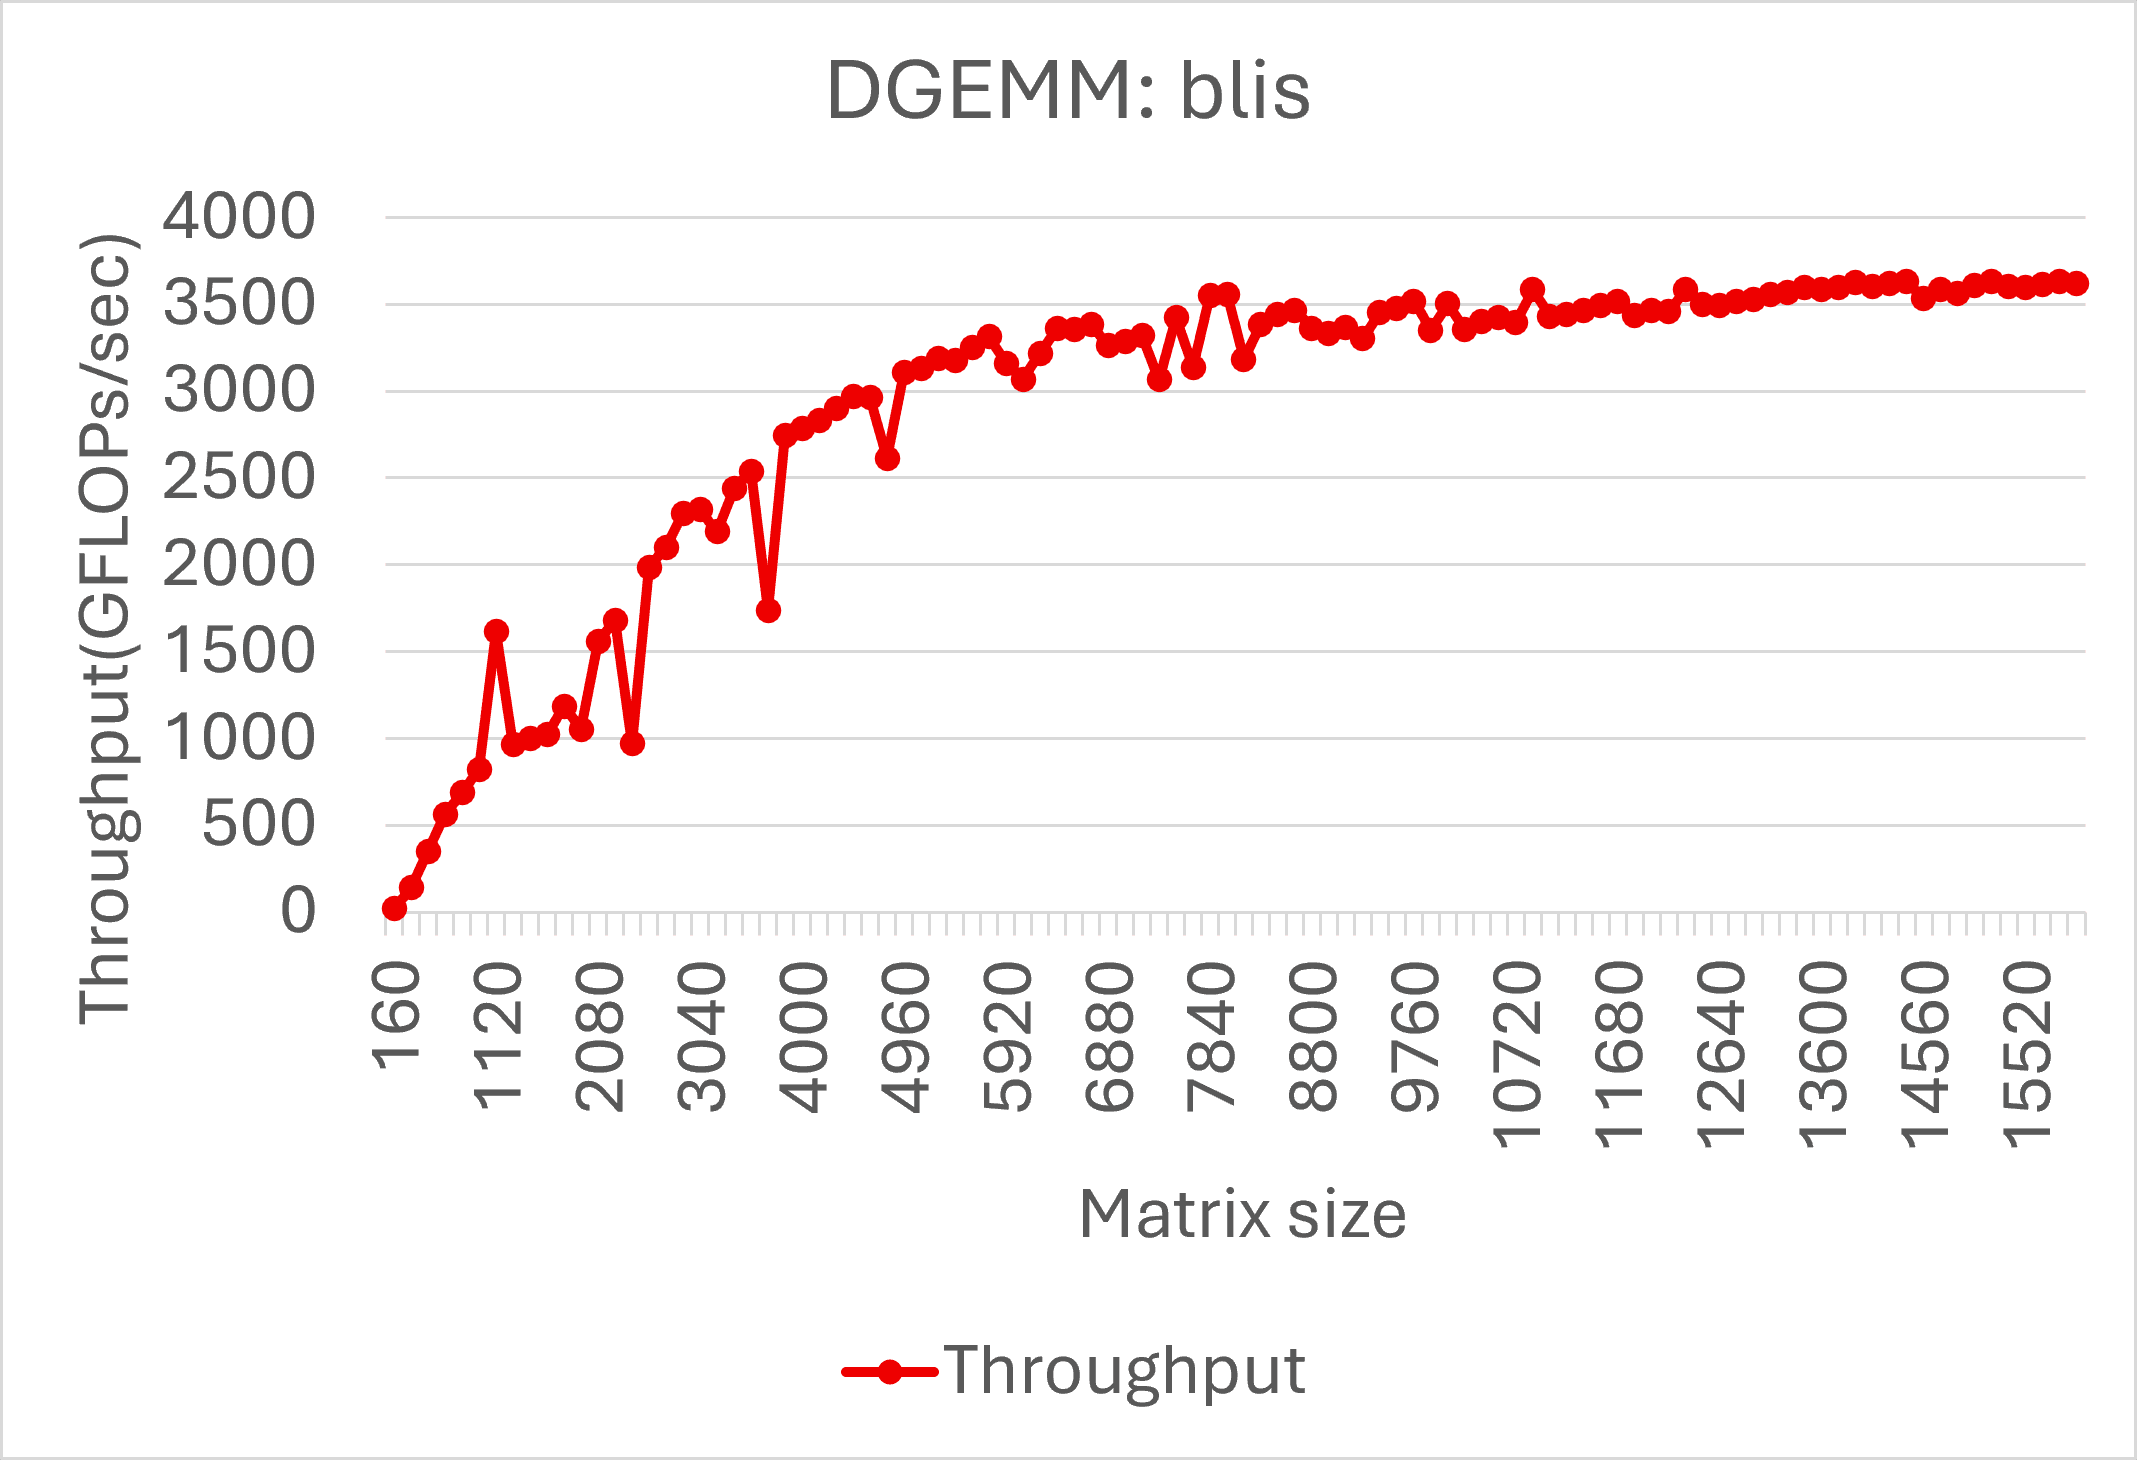 Fig. 2
Across increasing matrix sizes, DGEMM scales well and plateaus at ~3.6 TFLOPS (Figure 2), consistent with a compute-dominated steady state where additional data reuse and blocking reduce sensitivity to external memory. During each matrix multiplication iteration, CPU utilization peaks near 100%. APP enables us to collect DRAM bandwidth for both read and write and these DRAM metrics further support a compute-bound interpretation. On this system, the maximum sustained bandwidth measured by STREAM Triad is ~252 GB/s, while DGEMM reaches a peak of ~117 GB/s (47% of peak). This substantial bandwidth headroom shows that DGEMM performance is not constrained by DRAM bandwidth; instead, the dominant limits are inside the core pipeline and execution resources
Microarchitectural Bottleneck Diagnosis via TDA:
The Ampere PMU Profiler’s Top‑Down Accounting (TDA) (Figure 3) breaks down where cycles are spent and why throughput saturates:
- Level 1 - (Pipeline): Backend Bound dominates DGEMM is primarily backend bound, meaning the frontend is generally able to supply work, and performance is limited by the backend’s ability to execute/complete instructions.
- Level 2 - Core Bound: The backend time is largely core bound, indicating that cycles are spent actively executing compute (dense FP math) rather than waiting on the memory hierarchy. This aligns with DGEMM’s expected behavior once blocked kernels operate from cache.
- Level 3 - Resource Bound: (Execution Unit Pressure, especially FSU) Within core bound, TDA attributes the dominant component to resource bound, highlighting pressure on execution resources most notably the FSU (floating‑point/SIMD units). This suggests DGEMM is nearing the sustainable throughput limits of the FP/vector pipelines (e.g., issue/execute bandwidth, unit availability, or related scheduler/queueing constraints) rather than stalling on data delivery.
- Low “L2/Memory” contribution: The relatively small portion attributed to memory at Level 2 reinforces that DGEMM is not memory bandwidth bound on AmpereOne for the profiled sizes and implementation.
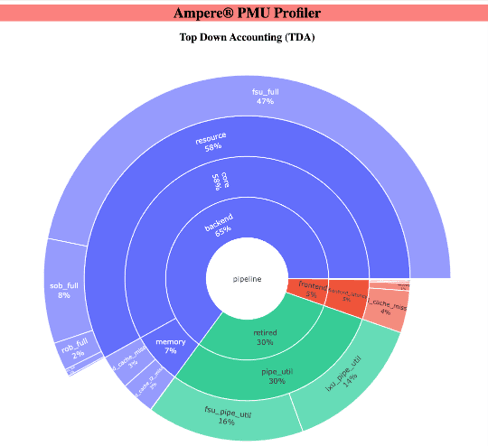 Fig. 3
#2 Diagnose false sharing from a coherence signature
A common multithreaded symptom is poor scaling even when each thread updates a logically independent variable. False sharing occurs when those variables live on the same cache line, so each write invalidates another core's copy and turns independent updates into coherence traffic.
Method: Using APP to distinguish coherence ping-pong from generic memory pressure
We started from that symptom and used APP to compare the slow layout against a padded or aligned control under identical CPU pinning. The diagnostic question was whether the slowdown came from cache capacity or DRAM bandwidth limits, or from coherency traffic caused by cache-line bouncing.
| Metrics | Aligned control | Suspected false sharing |
|---|---|---|
| IPC | 1.17 | 0.47 |
| l2d_inv_pki | 0.01 | 6.74 |
| l2_snoops_pki | 0.06 | 6.85 |
| l2d_inv_per_snoop | 0.15 | 0.99 |
| slc_miss% | 32.61 | 86.30 |
- IPC drops from 1.17 in the aligned control to 0.47 in the suspected-sharing case, a roughly 2.5x reduction in useful work per cycle.
- l2d_inv_pki jumps from 0.01 to 6.74. That is a coherence signature: the cache hierarchy is repeatedly invalidating lines instead of simply serving steady-state hits and misses.
- l2_snoops_pki rises from 0.06 to 6.85, showing the interconnect is flooded with coherence probes and ownership transfers rather than ordinary memory traffic.
- l2d_inv_per_snoop rises from 0.15 to 0.99. In other words, nearly every snoop in the slow case forces an invalidation, which is what you expect when two cores keep contending for write permission on the same cache line.
Taken together, these results show how APP can detect false sharing from a coherence signature. The combination of lower IPC, sharply higher invalidation and snoop activity, and recovery in the padded or aligned control points to cache-line ping-pong rather than generic memory pressure. In other words, APP was able to identify false sharing as the cause of the slowdown
#3: Use APP and TopDown Accounting to detect AI inference bottlenecks
We profiled Meta’s LLaMA benchmark using the llama.cpp inference engine with a Llama 3.1 8B quantized (int8) model to understand the limitations of CPU-side inference throughput. The key observation was that the workload behaves differently across phases: prompt processing is relatively compute heavy, whereas token generation becomes much more memory intensive because model weights and KV-cache data must be repeatedly moved through the memory hierarchy. For that reason, the analysis focused on the steady-state token generation phase rather than mixing it with prompt processing.
Method: Using phase-aware TDA and PMU metrics to separate compute limits from memory limits
We verified that the workload was spending more than 90% of CPU time in user space, which ruled out obvious kernel or system-level overheads. APP was used to collect TopDown Accounting (TDA) on the active inference core and PMU events over 10-second windows, timing collections separately for prompt processing and token generation. That phase separation mattered, because combining the two would blur a compute-bound region with a memory-bound one.
- TDA showed the token-generation phase to be highly backend bound at peak load, which immediately pointed away from a frontend delivery problem and toward data-side stalls.
- As the number of inference processes increased, token-generation throughput scaled near-proportionally up to three processes. Beyond that point, memory bandwidth saturated while useful throughput plateaued, showing that additional parallelism was no longer translating into more tokens per second.
- In the code-level deep dive, the IPC of the top function showed long low-IPC troughs alternating with higher-IPC regions. Correlating those periods with APP metrics and perf-guided hotspot analysis helped narrow the bottleneck and reduce the frequency and duration of those stalls, yielding more than 2x performance improvement.
This case study shows how APP and TopDown Accounting (TDA) can clearly expose the real bottleneck in LLM inference. By isolating the token-generation phase, APP showed that performance was primarily limited by backend stalls driven by memory-bandwidth pressure.
Related Content
Ampere Computing LLC
4655 Great America Parkway Suite 601
Santa Clara, CA 95054